Smart building occupancy counter: the KPIs that matter floor by floor
A smart building occupancy counter is only worth installing if it reports numbers a facility, energy or property team can act on the same week. In a multi-tenant office or a mixed-use asset that means treating the building as a stack of zones rather than as one front door, and measuring each of them separately.
- Live and peak occupancy per floor and per zone. Live counts are what ventilation rates, heating and cooling setpoints and lighting schedules should follow; peak counts are what you size plant and amenities around. Both come from the same entry and exit events at the floor threshold.
- Desk and workstation utilisation. How many of the seats on a floor are genuinely in use across the day, and how far the busiest hour sits above the daily average. This is the number behind every desk-ratio, hot-desking and floor-release decision, and it is usually far lower than badge data suggests.
- Meeting-room utilisation versus bookings. Rooms blocked in the calendar but empty in reality, and rooms used by walk-ins with no booking at all. Counting the people in the room rather than the invitations in the system is the only way to separate the two.
- Lobby and lift-bank flow. Arrivals per minute at the ground floor, the shape of the morning and lunch peaks, and how long the lift lobby stays congested. Lift dispatch, reception staffing and turnstile lane counts are all decided from this curve.
- Canteen and amenity occupancy. Seat occupancy and arrival rate at the office canteen or cafeteria, so sittings can be staggered, food waste reduced and queues kept inside the service window.
- Occupancy against safety capacity. The live headcount per floor compared with the permitted limit, plus a roll-call number the moment an alarm sounds, so marshals know how many people were on each level rather than how many badged in that morning.
- Usage since the last clean. Visits to each washroom block, tea point and quiet zone between cleaning rounds, which is what turns a fixed cleaning rota into a demand-driven one.
- Tenant share of building traffic. Each tenant floor as a proportion of total building entries, the basis for service-charge apportionment and for space-as-a-service pricing.
Where a smart building footfall counter goes
Coverage in a building is layered. The ground floor tells you who is in the asset, the floor thresholds tell you where they went, and the room-level sensors tell you what they used. A smart building footfall counter programme normally starts at the first two layers and adds the third on the floors where space decisions are being made.
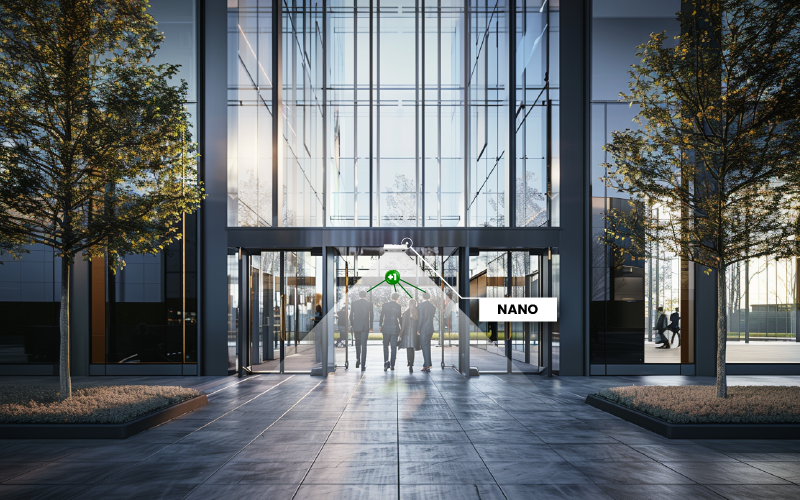
- Main entrances, revolving doors and turnstile lines. The building total and the visitor-versus-occupant split start here. Nano AI is the standard indoor choice: an AI sensor mounted overhead that counts entries and exits directionally, including across wide lobby openings.
- Double-height lobbies, atria and lift banks. Where ceilings are high, glazing is heavy and light levels swing through the day, Nano Prime 3D stereo counting holds up better than a single-lens device, and it is the usual pick above lift lobbies and escalator landings.
- Floor thresholds off the lift lobby and the stair cores. One sensor per access point per floor gives you floor occupancy without asking anyone to badge in, which is what the BMS needs for zone-level control.
- Open-plan desk zones, collaboration areas and meeting rooms. Zone counting at the neighbourhood level answers utilisation questions without per-desk hardware; room-level counting answers the booked-but-empty question. Pair this with zone analytics and heatmaps to see which parts of a floor are actually inhabited.
- Canteen, coffee points and washroom corridors. Entry and exit counts here drive both cleaning triggers and amenity scheduling.
- Car parks, campus gates, courtyards and external entrances. Nano Outdoor is built for weather and outdoor light, so the campus perimeter and the plaza can be counted on the same platform as the interior.
- Anywhere a live number has to be visible. VCare shows real-time occupancy on a screen at a floor entrance, a canteen door or a fitness suite, and can be set to warn when a zone approaches its limit.
Every sensor reports into BoostBI, V-Count’s cloud analytics platform, so lobby, floor, room and outdoor counts sit in one dashboard rather than in four systems. If you are new to the technology, the people counting overview explains how the sensors and the platform fit together.
How building operators use smart building footfall monitoring
Smart building footfall monitoring pays for itself in decisions, not in dashboards. These are the ones facility, energy and property teams make from the data most often.
- Drive HVAC and lighting schedules from presence. Floors that empty at 16:00 on Fridays and fill at 09:30 on Tuesdays do not need the same plant schedule. Occupancy per zone lets you shorten pre-conditioning, trim ventilation in under-used areas and stop lighting empty wings, without waiting for a complaint.
- Release or re-plan space. When a floor never exceeds a fraction of its seats, the choice between sub-letting, consolidating two floors into one or converting a wing to collaboration space becomes an evidence-based one. The same figures support desk-ratio targets.
- Clean by usage, not by rota. Cleaning teams are dispatched to the washroom block or the tea point that has passed a usage threshold, and lightly used floors drop to a longer cycle. Consumables ordering follows the same counts.
- Bill tenants for the space they use. In space-as-a-service and flexible-lease models, floor-level entry counts give a defensible basis for service-charge apportionment or for usage-based pricing, and they settle disputes about who is generating the load on shared amenities.
- Hold safety capacity and evacuate on real numbers. Live occupancy per floor can be capped, alerted on and displayed, and at the moment of an alarm the count per level is the roll-call marshals work from.
- Schedule amenities and lifts around the peaks. Canteen sittings, reception cover, security lanes and lift dispatch profiles are all set from the arrival curve. Where the ground floor regularly backs up, pair counting with queue management to measure the wait rather than guess at it.
Smart building visitor analytics for tenant reporting, ESG and BMS integration
Smart building visitor analytics becomes far more valuable once the counts leave the dashboard and reach the systems that already run the building. BoostBI exposes occupancy and footfall data through an API, so floor and zone counts can be pulled into a building management system, an energy monitoring platform, a workplace or room-booking tool, or a corporate data warehouse on whatever interval those systems expect.
In practice that means the BMS makes its own decisions with a real occupancy input rather than a timetable, and the workplace team sees utilisation next to bookings instead of in a separate report.
The same data is what most ESG and energy reports are missing. Energy intensity, ventilation performance and carbon reporting all read very differently when they are normalised per occupant-hour rather than per square metre, and occupancy counts give you that denominator continuously instead of from an annual survey.
Alerts and scheduled exports can be set per floor, per tenant or per zone, so the facility manager, the sustainability lead and the landlord each receive the slice they are accountable for.
Counting sensors report numbers, not identities: the output is anonymous entry, exit and occupancy events per zone, which keeps building-wide monitoring compatible with tenant and employee privacy expectations in a way that badge logs and desk sensors tied to individuals are not. If you want to see the platform against your own floor plan, request a demo and we will walk through sensor placement floor by floor.
Smart building people counting FAQ
What is a smart building occupancy counter?
It is a sensor-and-software system that measures how many people are inside a building and inside each part of it, in real time. Overhead sensors at entrances, floor thresholds, meeting rooms and amenity doors record directional entries and exits; the platform turns those events into live occupancy, peak occupancy and dwell per zone.
V-Count does this with Nano AI, Nano Prime and Nano Outdoor sensors reporting into BoostBI, so a facility team sees the building total, each floor and each room in one place instead of inferring occupancy from badge swipes or Wi-Fi associations.
Can occupancy data actually control our HVAC and lighting?
Yes, indirectly and safely. BoostBI publishes zone-level occupancy through an API, and your building management system consumes it as an input to its own control logic, so ventilation rates, setpoints and lighting schedules respond to how full a floor really is.
Nothing in the counting layer commands plant directly. Most buildings start in monitoring mode, compare measured occupancy against the existing timetable for a few weeks, and only then let the BMS act on the feed.
The comparison alone usually exposes hours of conditioning of empty space.
How do you measure desk and meeting-room utilisation without sensors on every desk?
By counting people into and out of zones rather than instrumenting furniture. A neighbourhood or wing is bounded by a small number of access points, so sensors there give you how many people are working in that area through the day, which is what desk-ratio and floor-release decisions need.
Meeting rooms get their own sensor over the door, which is how you find rooms that are booked but empty and rooms used without a booking. It scales to a whole floor at a fraction of the hardware count of per-desk devices.
Can we bill tenants or price space-as-a-service from these counts?
Yes. Floor-level and tenant-boundary counting gives each tenant a measured share of building entries and a measured occupancy profile, which is a defensible basis for apportioning service charges, for usage-based pricing in flexible-lease and space-as-a-service models, and for settling disagreements about who is loading shared amenities.
BoostBI can export or push those figures per tenant on a schedule, so the numbers that appear on an invoice come from the same record the facility team works from rather than from a separate manual count.
Does a smart building footfall counter integrate with our BMS and workplace tools?
It does. BoostBI provides an API that exposes footfall and occupancy per zone, so a building management system, an energy monitoring platform, a room-booking or workplace app and a corporate data warehouse can each pull the counts they need at the interval they expect.
Integration is generic rather than vendor-specific, which means it does not matter greatly which BMS you run. Alerts and scheduled exports can also be defined per floor, per tenant or per zone for teams that would rather receive data than query it.
Can the counts be used for safety capacity and evacuation?
Yes, and this is one of the strongest cases for counting at the floor threshold. Live occupancy per floor can be capped, alerted on and shown on a VCare display at an entrance, so a zone approaching its permitted limit is visible before it is breached.
When an alarm sounds, the count per level is a far better roll-call basis than a badge-in log, because it reflects who is actually upstairs at that moment rather than who entered the building that morning. Treat it as decision support alongside your existing life-safety procedures.
Do the sensors recognise or identify individuals?
No. The output is anonymous: directional entry, exit and occupancy events per zone, with no identity attached. That distinction matters in workplaces, because occupancy reporting built on badge logs or on desk sensors tied to named users raises questions with tenants, works councils and employees that anonymous counting does not.
Counts can be aggregated to the floor, the tenant or the whole asset for reporting without anyone being tracked individually through the building.
Which sensor suits a high atrium lobby, and which suits the campus outside?
For a double-height lobby, an atrium or a lift bank with strong daylight and glazing, Nano Prime 3D stereo counting is the usual choice because it handles height and changing light better than a single-lens device. Standard-height indoor areas, floor thresholds, meeting rooms and canteen doors are covered by Nano AI.
Outside the envelope, at campus gates, plazas, courtyards and car park entrances, Nano Outdoor is built for weather and outdoor lighting. All three report into the same BoostBI account, so indoor and outdoor counts stay comparable.
How does canteen occupancy fit into building-wide monitoring?
The canteen is usually the sharpest peak in the building and the one amenity where a bad hour is felt by everyone. Counting people into and out of the servery and seating area shows the arrival curve, the seat occupancy through the lunch window and how long the peak lasts, which lets you stagger sittings, staff service lines to the curve and reduce over-production.
Because it runs on the same platform as the rest of the building, canteen load can be read against floor occupancy on the same day. See our office cafeteria people counting page for more detail.